Which code editors and AI coding tools do people search for?
A live ranking of AI coding tools and IDEs by real Google search demand, worldwide and by country, updated every month. As of Aug 2026, Claude Code leads with 29.2% of tracked demand, ahead of VS Code. As a category it is concentrated (HHI 0.168). Search interest is the closest public proxy for what is actually being used, so the index shows the pecking order and, more usefully, what is rising and what is fading.
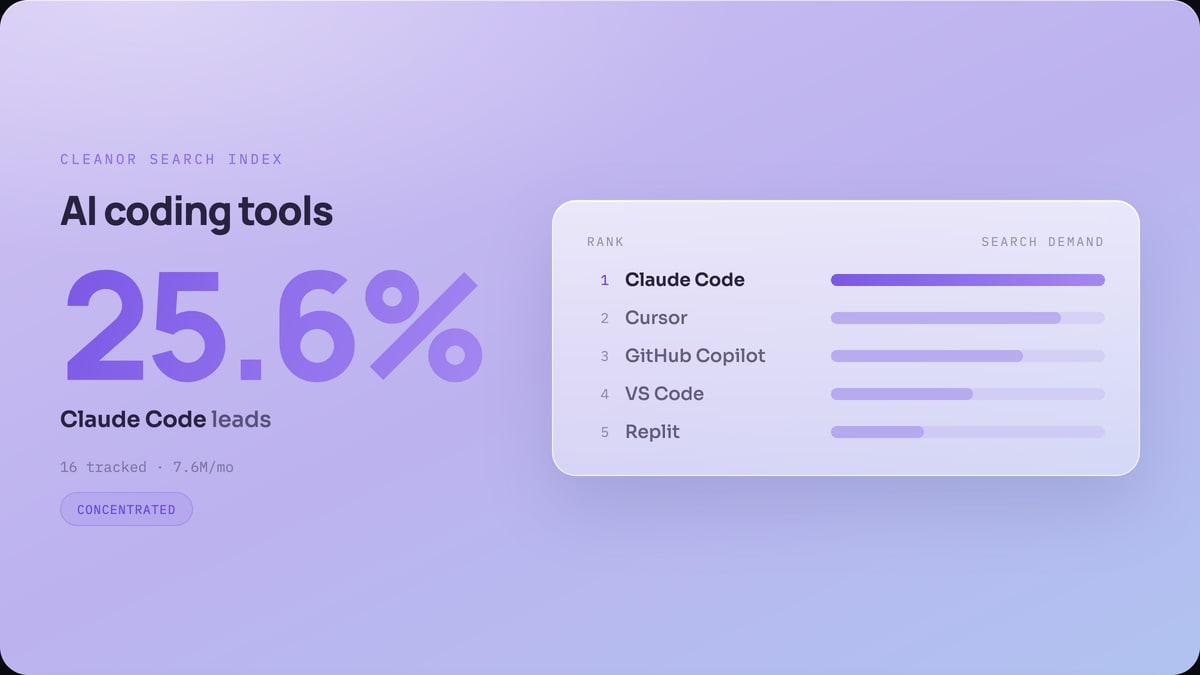
| # | coding tool or IDE | ↓ Share | Relative | 12-mo trend | MoM | YoY |
|---|---|---|---|---|---|---|
| 1 | Claude CodeAI coding agent | 29.2% | ▼ -12.4% | ▲ +162.6% | ||
| 2 | VS CodeEditor | 22.3% | ▲ +5.7% | ▼ -10.3% | ||
| 3 | ReplitCloud IDE | 12.8% | ▲ +2.1% | ▲ +14.8% | ||
| 4 | GitHub CopilotAI assistant | 6.7% | ▼ -4% | ▼ -24.1% | ||
| 5 | CursorAI editor | 6% | ▼ -5.4% | ▼ -25.4% | ||
| 6 | Visual StudioIDE | 5.9% | · -1.4% | ▼ -43.1% | ||
| 7 | Android StudioIDE | 5.1% | ▲ +2.5% | ▼ -7.6% | ||
| 8 | PyCharmIDE | 3.6% | ▲ +4% | ▼ -44.5% | ||
| 9 | IntelliJ IDEAIDE | 2.4% | ▲ +7.1% | ▼ -40% | ||
| 10 | Sublime TextEditor | 1.8% | ▲ +8.2% | ▼ -39.4% | ||
| 11 | XcodeIDE | 1.5% | · -2% | ▼ -5.6% | ||
| 12 | NeovimEditor | 1% | ▲ +8.9% | ▼ -19.8% | ||
| 13 | EclipseIDE | 0.5% | ▲ +37.1% | ▼ -33.5% | ||
| 14 | WindsurfAI editor | 0.4% | ▼ -25.1% | ▼ -59.2% | ||
| 15 | Amazon QAI assistant | 0.4% | ▼ -16.5% | ▼ -75% | ||
| 16 | ZedEditor | 0.4% | · -1.5% | ▲ +16.6% |
Open dataset
Every monthly snapshot is published as open CSV and JSON, free to reuse with attribution. The repository is a versioned, citable record of how demand shifts over time.
Method
Figures are average monthly Google searches for each coding tool or IDE, from Google Keyword Planner. Volumes are reported in bands (Google rounds them), so treat them as directional, not exact. Within a country the numbers are comparable; the Share view normalizes each item against the whole category so you can compare countries of very different sizes.
One head term per item. Search demand is nested: “claude ai”, “claude.ai” and “claude code” all sit inside “claude”, so the head term already captures them and adding the variants would double-count. We therefore track exactly one keyword per item. It is a deliberate choice: it can undercount longer-tail searches, but keeps everything on the same footing and avoids double counting. For names that are also a common word (Gemini the zodiac sign, Swift the singer, Go the verb) we use a disambiguated term; unambiguous names use the bare word. The single term for each item is listed below, so the method is fully auditable. Claude Code currently leads worldwide, ahead of VS Code. Data through Aug 2026.
| coding tool or IDE | Kind | Head search term |
|---|---|---|
| Claude Code | AI coding agent | claude code |
| VS Code | Editor | vs code |
| Replit | Cloud IDE | replit |
| Cursor | AI editor | cursor ai |
| GitHub Copilot | AI assistant | github copilot |
| Visual Studio | IDE | visual studio |
| PyCharm | IDE | pycharm |
| Android Studio | IDE | android studio |
| IntelliJ IDEA | IDE | intellij |
| Xcode | IDE | xcode |
| Sublime Text | Editor | sublime text |
| Neovim | Editor | neovim |
| Amazon Q | AI assistant | amazon q |
| Windsurf | AI editor | windsurf ai |
| Zed | Editor | zed editor |
| Eclipse | IDE | eclipse ide |
FAQ
Common questions about how the index is built.
How is AI coding tools and IDEs popularity measured here?
We use average monthly Google search demand for each coding tool or IDE, pulled from the Google Keyword Planner historical-metrics API. Search demand is nested, so we count exactly one head term per item: "claude" already contains "claude ai", "claude.ai" and "claude code", so counting only the head term avoids double-counting. This can undercount an item's longer-tail searches, but keeps everything comparable. Names that are also a common word use a disambiguated term. Within a country, volumes are directly comparable; the "Share" view normalizes each item against the whole category so countries of different sizes can be compared fairly.
How often is the index updated?
Once a month. Keyword Planner only exposes a rolling 12-month window, so we snapshot every month and keep the history, which is how the index can show longer-term rises and declines that Google itself does not expose.
Which AI coding tools and IDEs are tracked?
The current index covers 16: Claude Code, VS Code, Replit, Cursor, GitHub Copilot, Visual Studio, PyCharm, Android Studio, IntelliJ IDEA, Xcode, Sublime Text, Neovim, Amazon Q, Windsurf, Zed, Eclipse.
Can I download or cite the data?
Yes. The full dataset (monthly time series per country plus a ranked summary) is published as open CSV and JSON on GitHub, free to reuse with attribution. Each monthly snapshot is committed, so the repository doubles as a citable, versioned changelog.