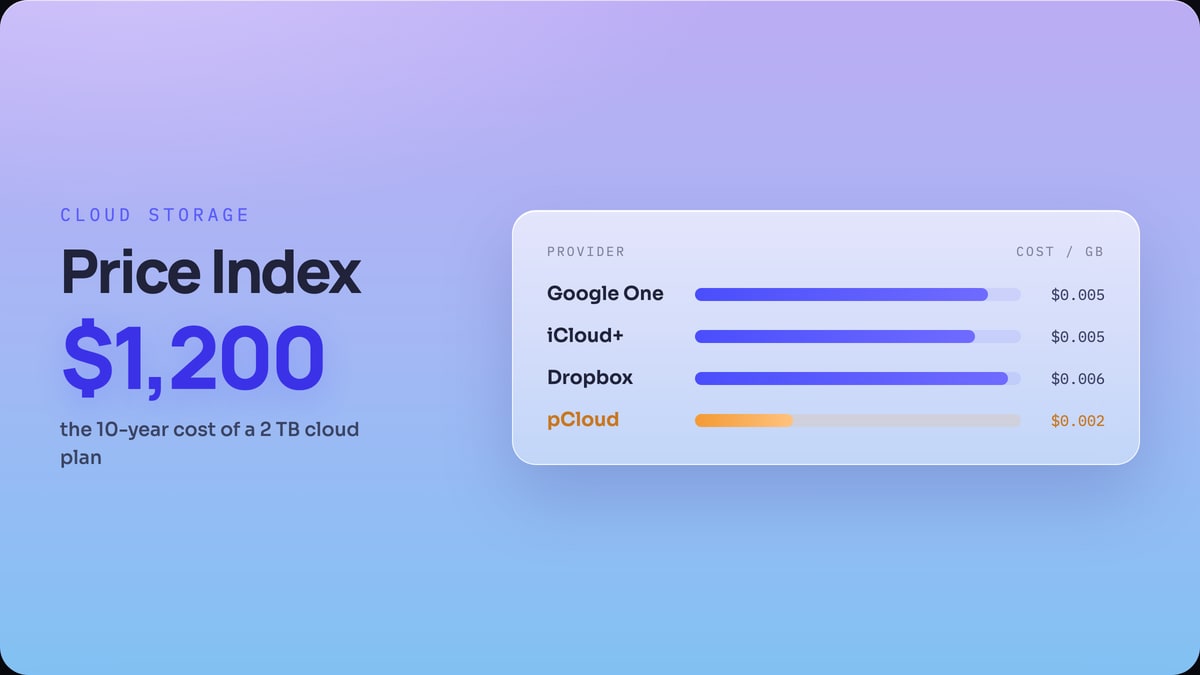
 Pricing index · July 2026
The Cloud Storage Price Index
Every major provider indexed by cost per GB. Storage is rent you pay forever, and the cheapest gigabyte is the one you delete.
Original data studies on how phones fill up and how to get the space back, built on first-party search data and reproducible benchmarks. Every study is free to read, cites its sources, and ships a downloadable journal-format PDF.
Pricing index · July 2026Every major provider indexed by cost per GB. Storage is rent you pay forever, and the cheapest gigabyte is the one you delete.
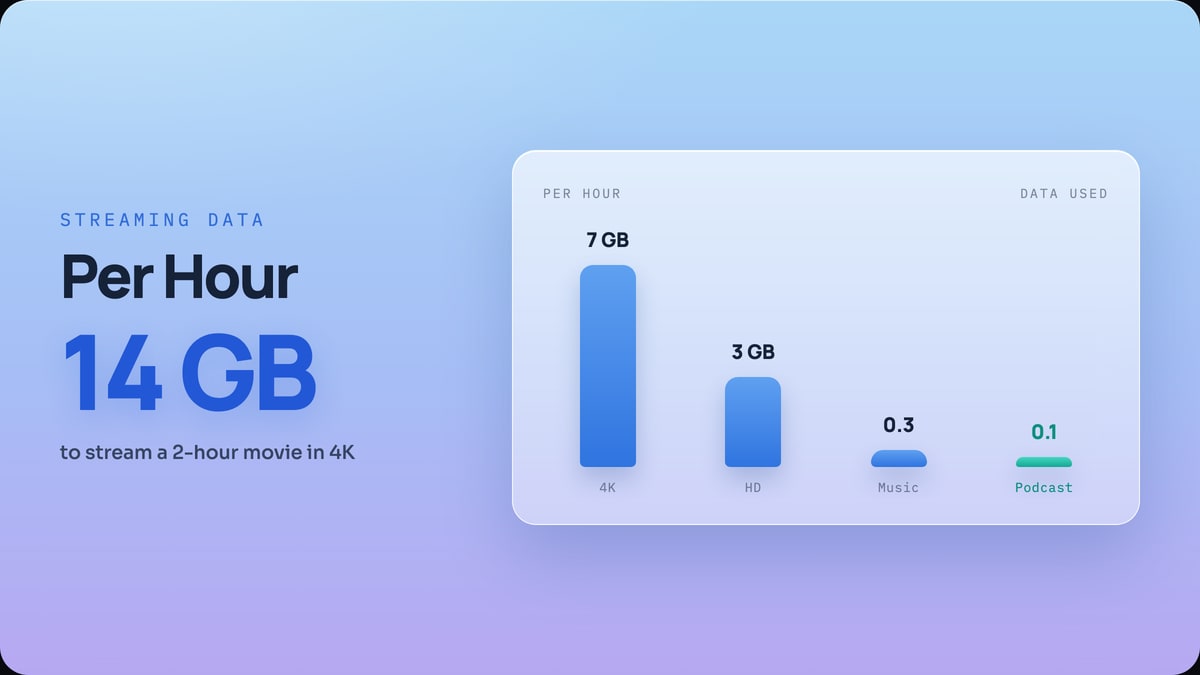 Data usage study · July 2026
Data per hour for Netflix, YouTube, Spotify and more, on one scale, with the audio numbers computed exactly from bitrate.
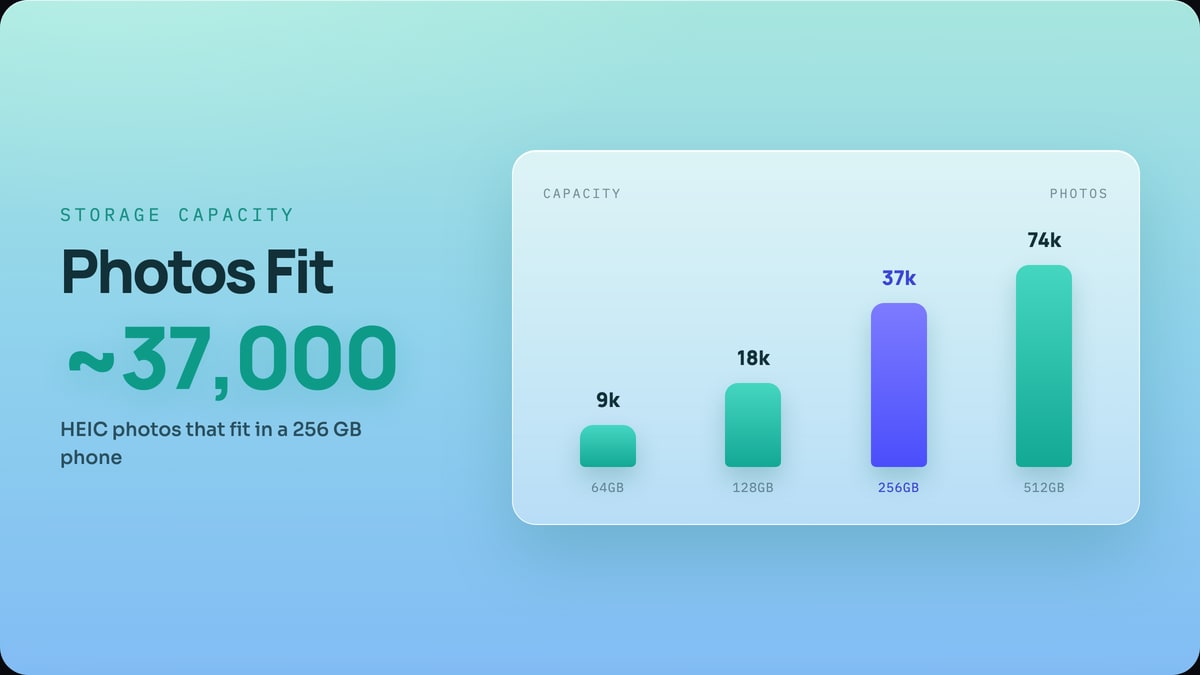 Storage capacity study · July 2026
How many photos and how much video actually fit in 64, 128, 256 and 512 GB, after the space your phone keeps for itself.
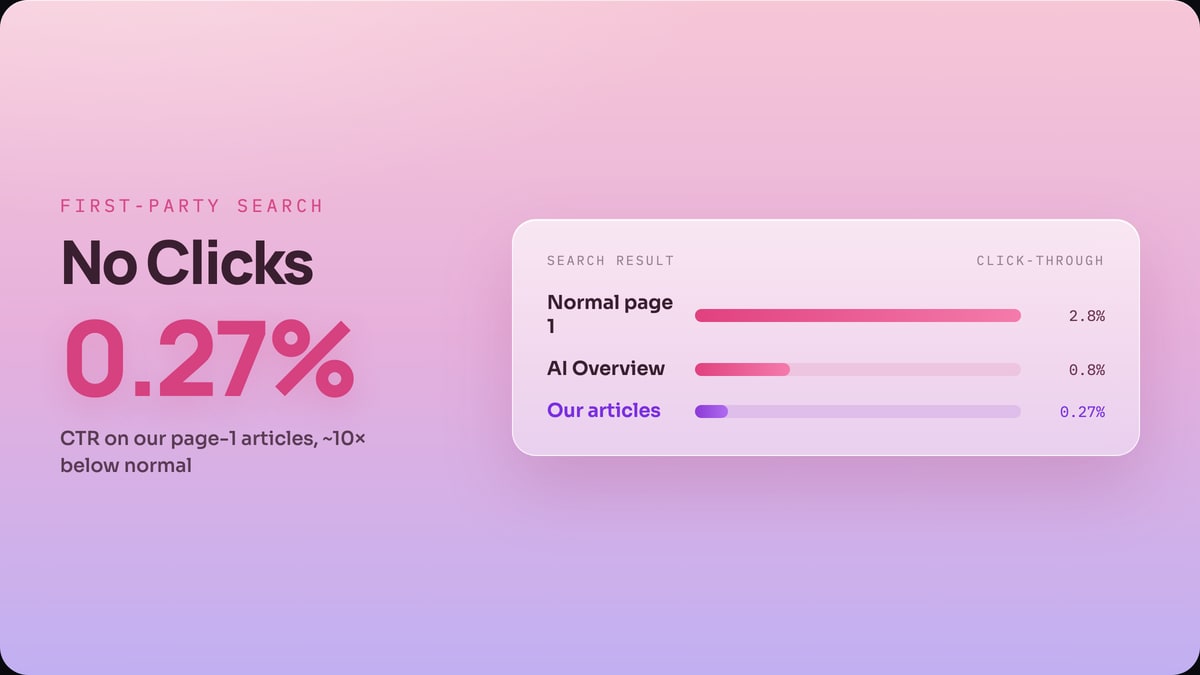 First-party search study · July 2026
First-party Search Console data: our articles rank on Google's page 1 but earn 0.27% CTR, about 10x below normal, because AI Overviews answer first.
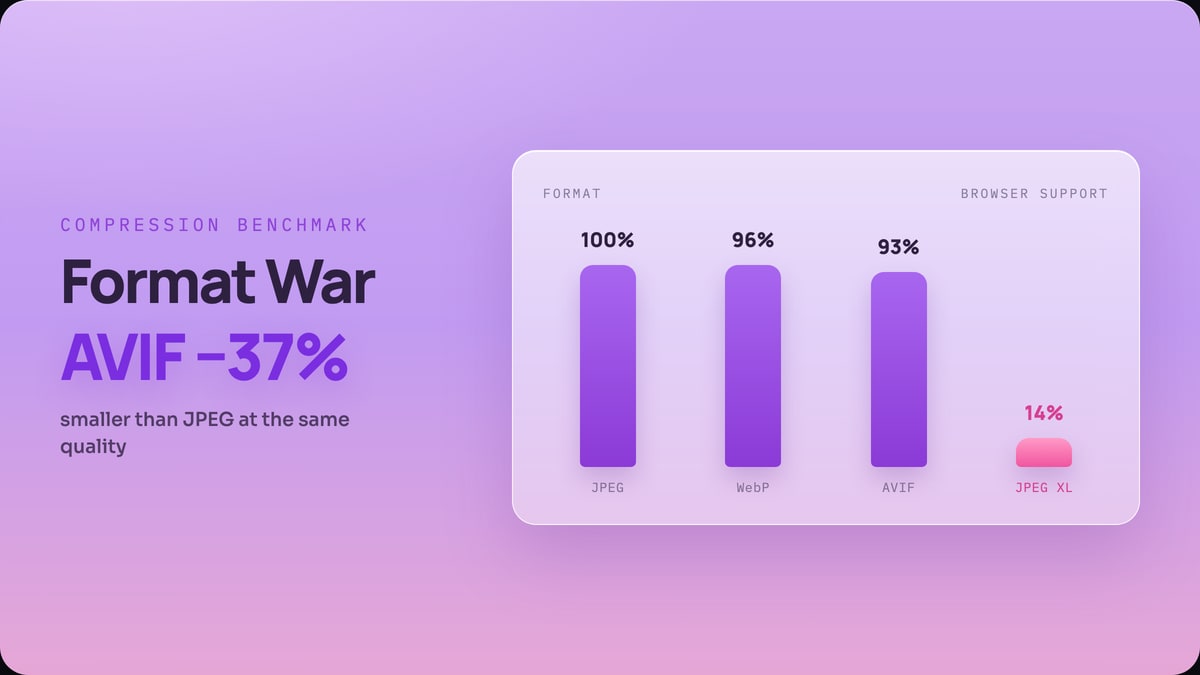 Compression benchmark · July 2026
JPEG, WebP, AVIF and JPEG XL tested at matched quality, plus 2026 browser support: AVIF wins, JPEG XL is stuck.
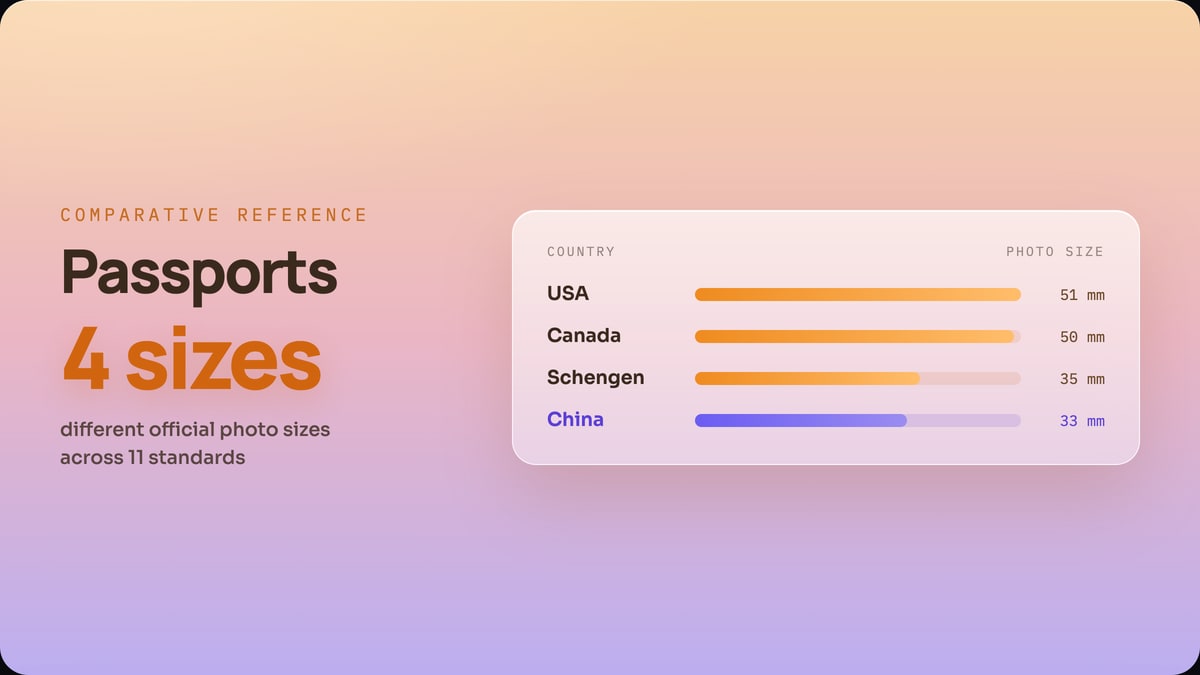 Comparative reference · July 2026
Official passport and visa photo rules for 11 countries compared, size, background, glasses and head measurement, none of them agree.
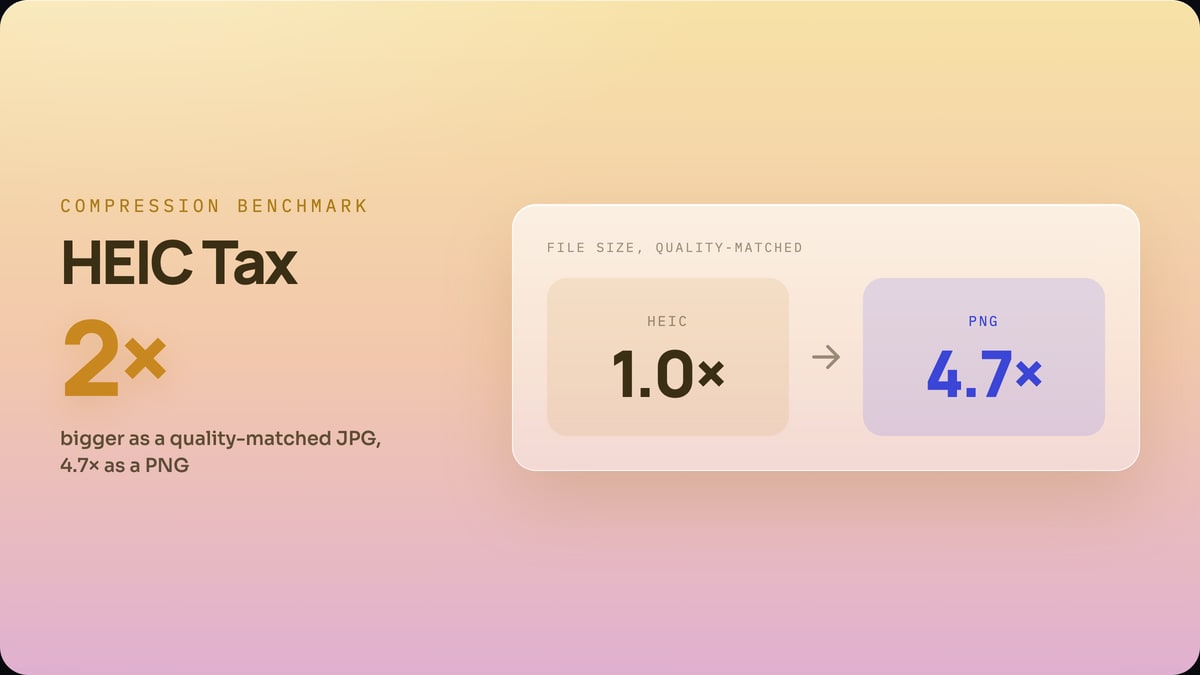 Compression benchmark · July 2026
96 controlled encodes measuring what converting an iPhone HEIC to JPG or PNG does to file size at matched visual quality.
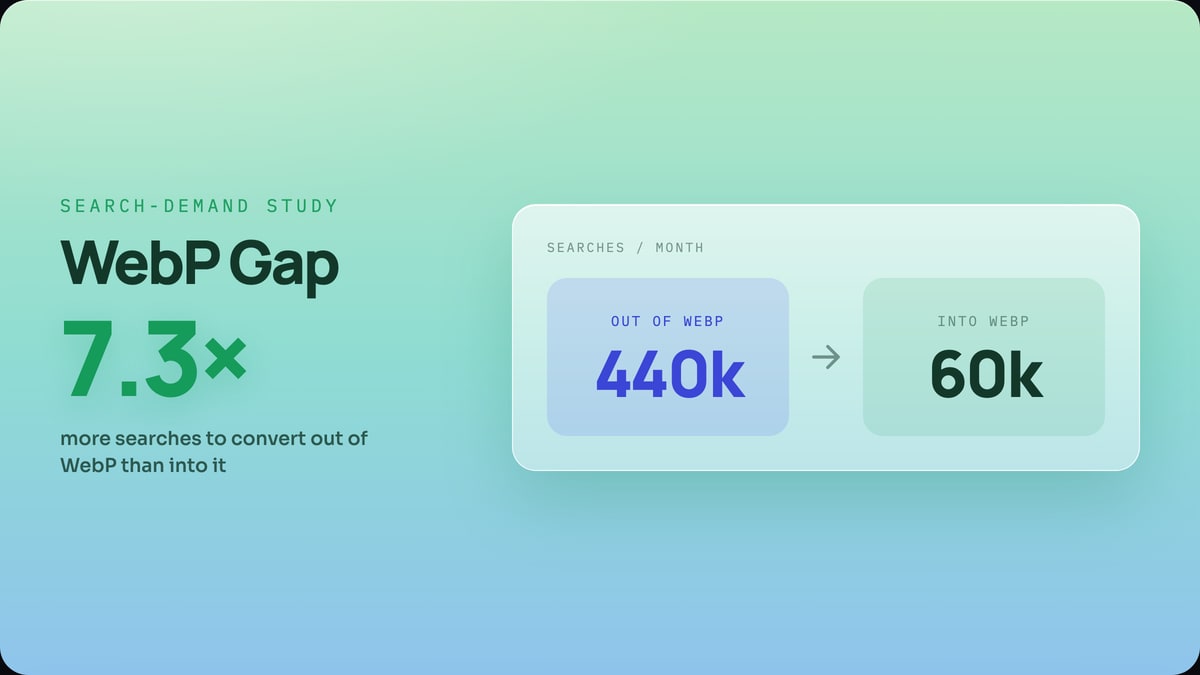 Search-demand study · July 2026
285 image-conversion keyword variants measured to size how many people convert images out of WebP versus into it.
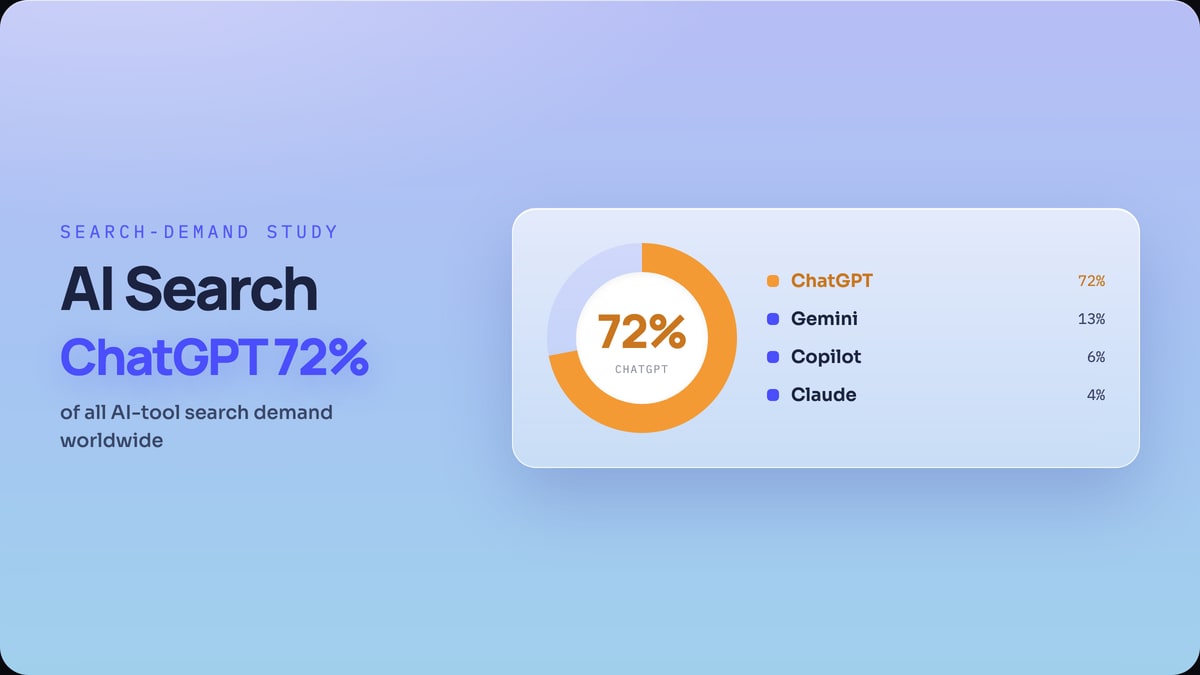 Search-demand study · June 2026
12 months of worldwide Google search demand for 13 AI tools, June 2025 to May 2026, with growth curves and a perception contrast.
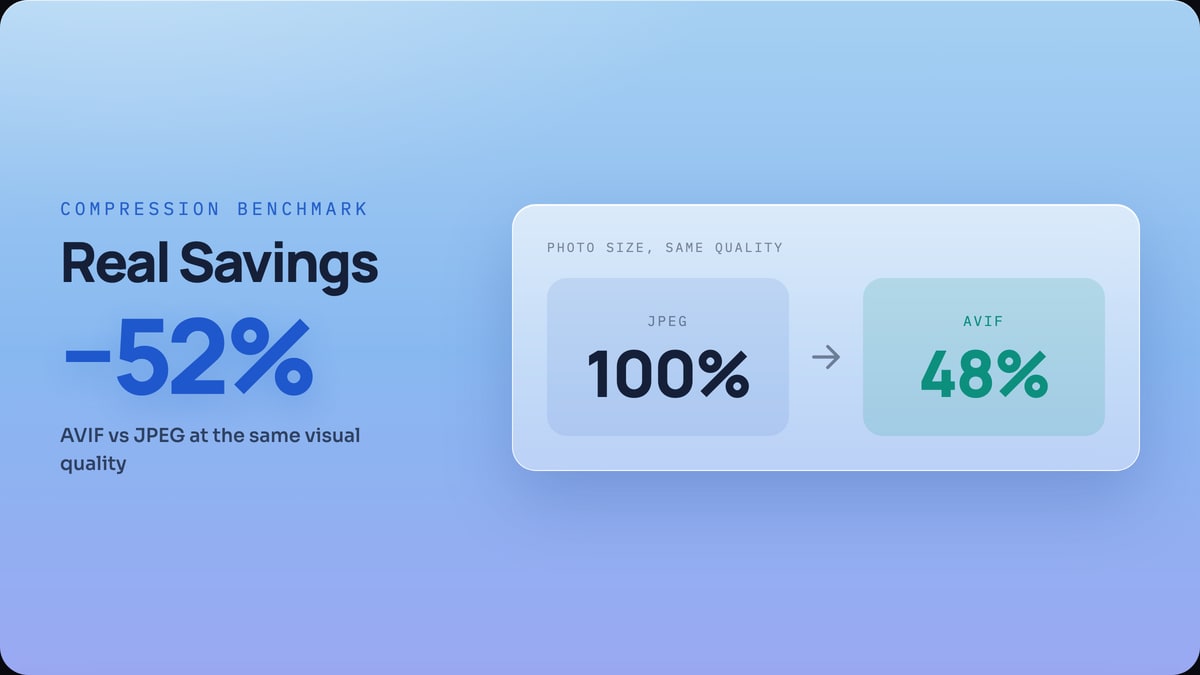 Compression benchmark · June 2026
768 image encodes measured at matched visual quality (SSIM) across lossless and real 12-megapixel photos.
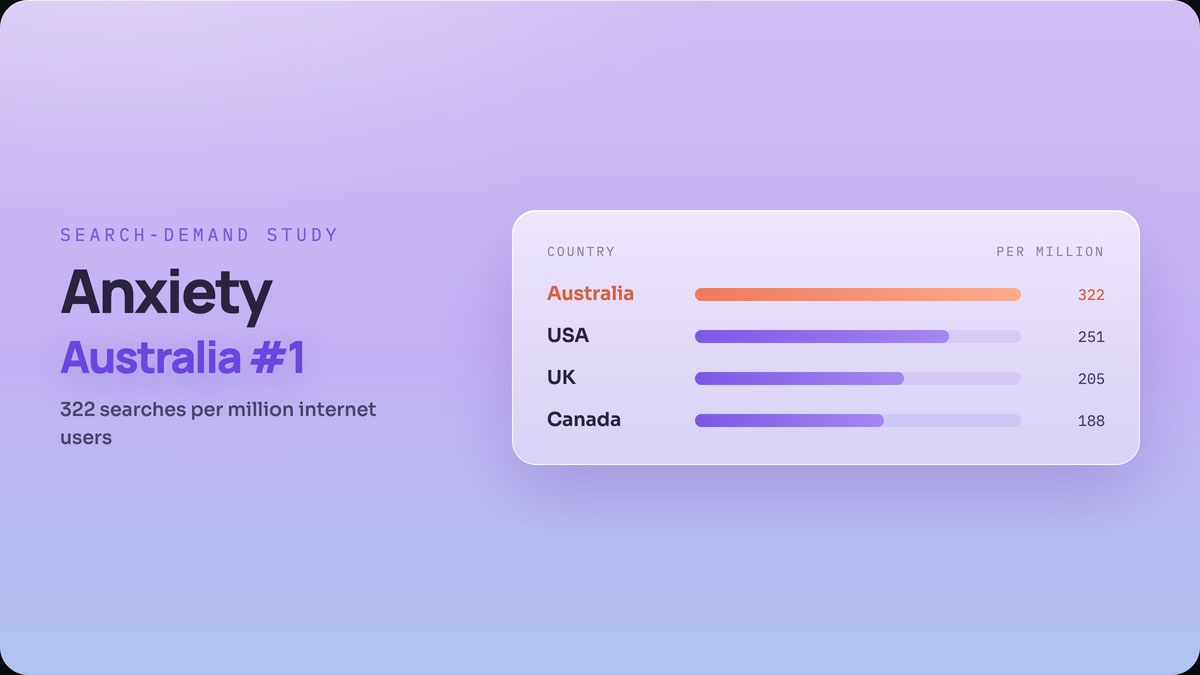 Search-demand study · June 2026
117,000 searches mapped by country and device, cross-checked against real market demand and normalized per capita.
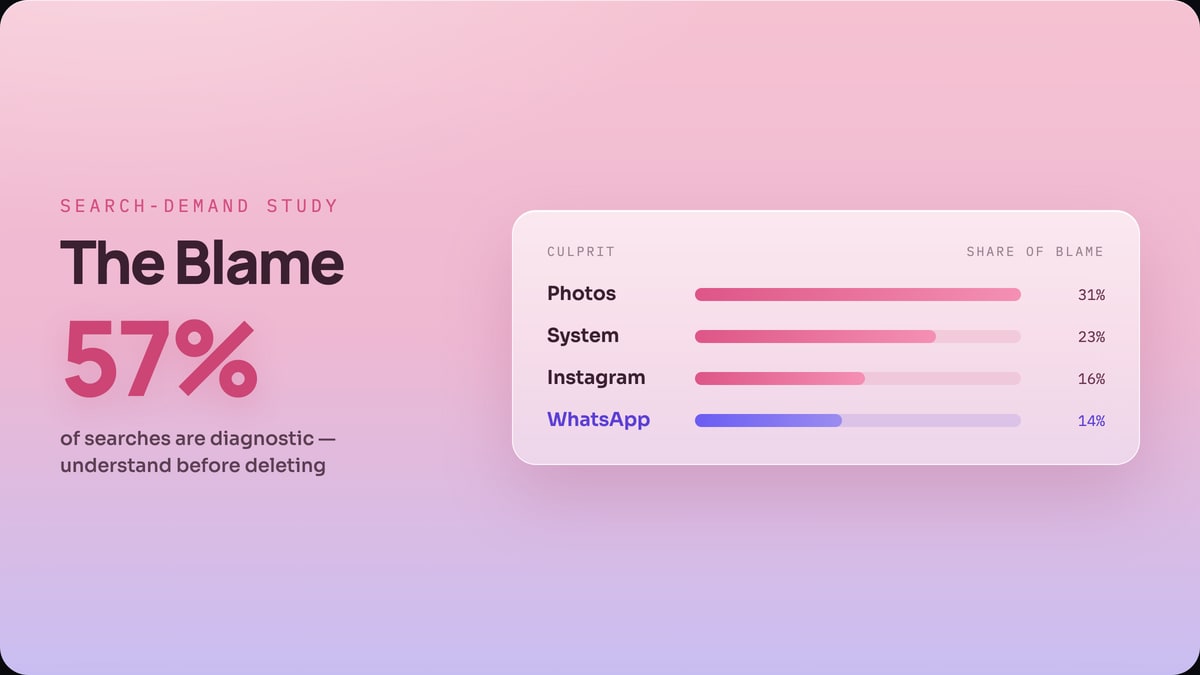 Search-demand study · June 2026
Perceived storage culprits ranked by search demand across a 90-day first-party Search Console corpus.
 Search-demand study · June 2026
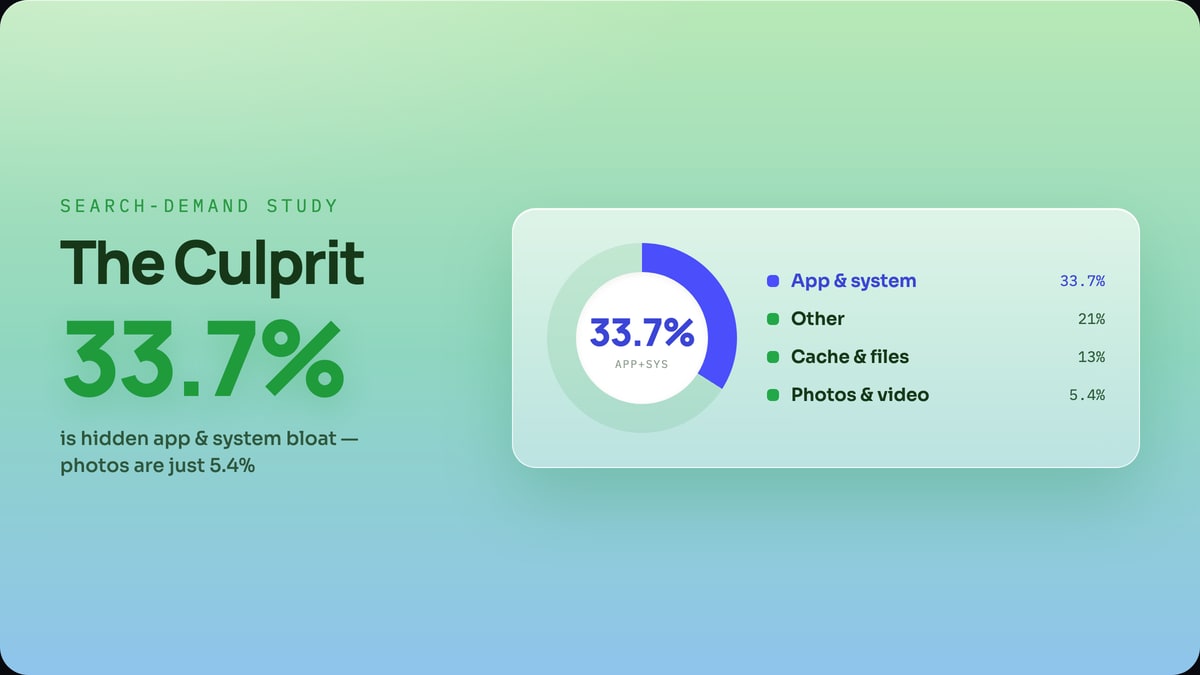
59,282 Google searches analyzed to find the real storage culprit, and it is not the photos everyone blames.
Cleanor Labs. Each one is an original data study rather than a roundup of other people’s numbers: it is built on first-party data or a benchmark anyone can re-run, and it cites its sources.
Yes. The datasets and the code behind these studies are archived on Zenodo under Cleanor Labs with permanent DOIs, released under CC BY 4.0, so they are citable in academic work. The Storage Lab datasets are 10.5281/zenodo.21217372 and the Cleanor Search Index is 10.5281/zenodo.21225547. Reuse them freely with attribution.
Yes. Every study ships a journal-format PDF you can download from its card here, with the same figures and the method written out.
Either first-party (our own search-demand and usage data) or from a benchmark we publish in full so it can be reproduced. Which one applies is stated in each study, and the general approach is on the methodology page.
No, and we do not claim to be. They are original studies published openly, with the data and the method in the open so anyone can check the work or disagree with it in public. The datasets are archived and versioned on Zenodo so a citation stays valid even if the site changes.
Yes, and that is the point of publishing the method. The compression studies list the encoder, the settings and the quality target, so the same corpus re-run on your machine should land within a point or two. If it does not, the discrepancy is a finding and we want to hear about it.
Numbers we measured ourselves rather than repeated from a press release: our own Search Console data (the AI Overview click-through study), our own encoding benchmarks (AVIF, WebP, HEIC), and Google Keyword Planner snapshots we capture monthly. Each study says which of those it is built on.
Search-demand studies are refreshed monthly from the latest Keyword Planner window. Benchmarks are dated at publication and re-run when a codec or a platform default changes, which is the only thing that would move them.
Yes, under CC BY 4.0: reuse the figures, the tables and the data with attribution and a link back to the study. The Zenodo DOIs give you a permanent citation that will not rot if a URL changes.
Every study uses first-party or openly reproducible data, cites its sources, and is free to cite with a link. Questions or press: hello@cleanor.app.